
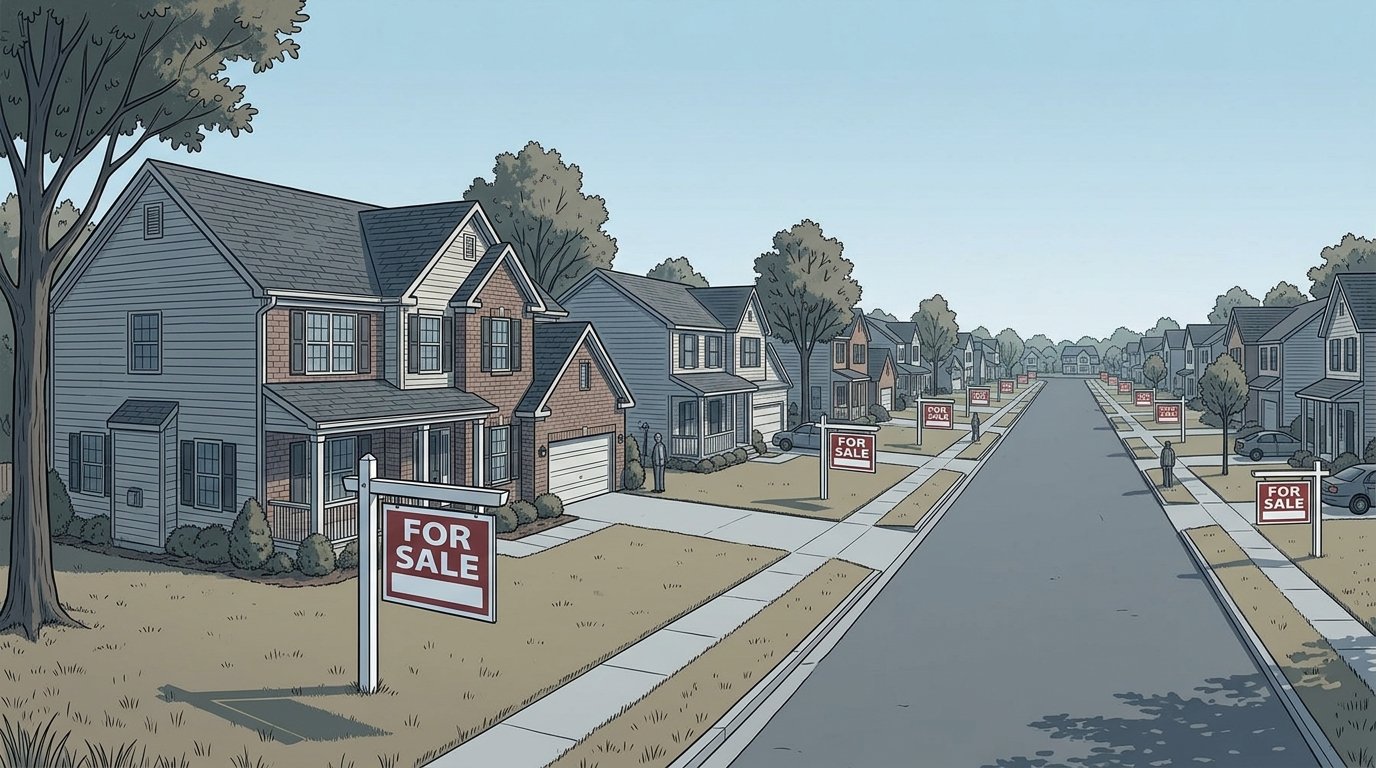
The real estate market is slowing down, as evidenced by a 58% gap where sellers outnumber buyers nationwide as of August 2026. This shift is part of a broader slowdown influenced by high mortgage rates and declining buyer demand, leading to increased inventory and longer time on the market.
The shift is visible in supply, rates, and buyer pullback
June 2022 marked a significant turning point in the real estate market. The number of available homes for sale, or inventory, increased by 19% from the previous year, as reported by homelight.com, following a period where buyers had limited options.
Higher borrowing costs hit first. Demand then cracked, and deals started failing.
- May 2022: 10.5% of sellers reduced their home prices, up from 6.2% a year earlier.
- June 2022: Mortgage rates doubled over the prior six months, rising from 3% to nearly 6%.
- June 2022: Mortgage applications for single-family homes dropped 17% from a year earlier.
- June 2022: Requests for home tours and other home-buying services fell by 14%.
- June 2022: 60,000 buyers backed out of their deals.
- August 2026: Sellers outnumbered buyers nationwide by 58%, the widest gap since Redfin began tracking it in 2013.
- August 2026: Pending home sales, which measure the number of new homes under contract, fell 4.7% from a year earlier.
This sequence is crucial because it demonstrates the mechanism, not just the mood. Rates rose, monthly payments worsened, fewer buyers applied, fewer toured homes, more contracts broke, and sellers had to cut prices more often.
By August, the market had 4.9 months of supply, the highest level in over a decade. If you are selling, watch contract activity before asking prices, as prices were still up 1.6% year over year, even as sales demand weakened.
This slowdown matters because sellers now outnumber buyers
August 2026 is where the answer becomes clear: yes, the real estate market is slowing down, and this phase matters more because sellers now outnumber buyers by 58% nationwide, according to cnn.com.
This shift changes bargaining power before it fully affects headline prices. The market had 4.9 months of supply, meaning current listings would last that long at the current sales pace, and cnn.com reported that was the highest level in more than a decade. Meanwhile, the median existing-home sales price still rose 1.6% from a year earlier in August 2026.
- Sellers outnumber buyers by the widest margin since this measure began, indicating a broad, not local or temporary, imbalance.
- Supply has built up to a level last seen more than a decade ago, giving buyers more room to wait, negotiate, or walk.
- Demand is weakening in live transaction measures: pending sales fell 4.7% in August from a year earlier.
- Buyer intent is weaker even before contracts are signed, with purchase mortgage applications down 19% from a year earlier.
- Financing remains expensive, with mortgage rates above 6% since 2022, maintaining pressure on demand.
If you are selling, this is when stale listings start to matter more than last month’s comparable sale. Watch whether supply keeps rising faster than sales.
Who is exposed now, and who still has cover
August 2026 is the tell. Sellers outnumbered buyers nationwide by 58%, according to CNN, and the market held 4.9 months of supply, the highest level in more than a decade.
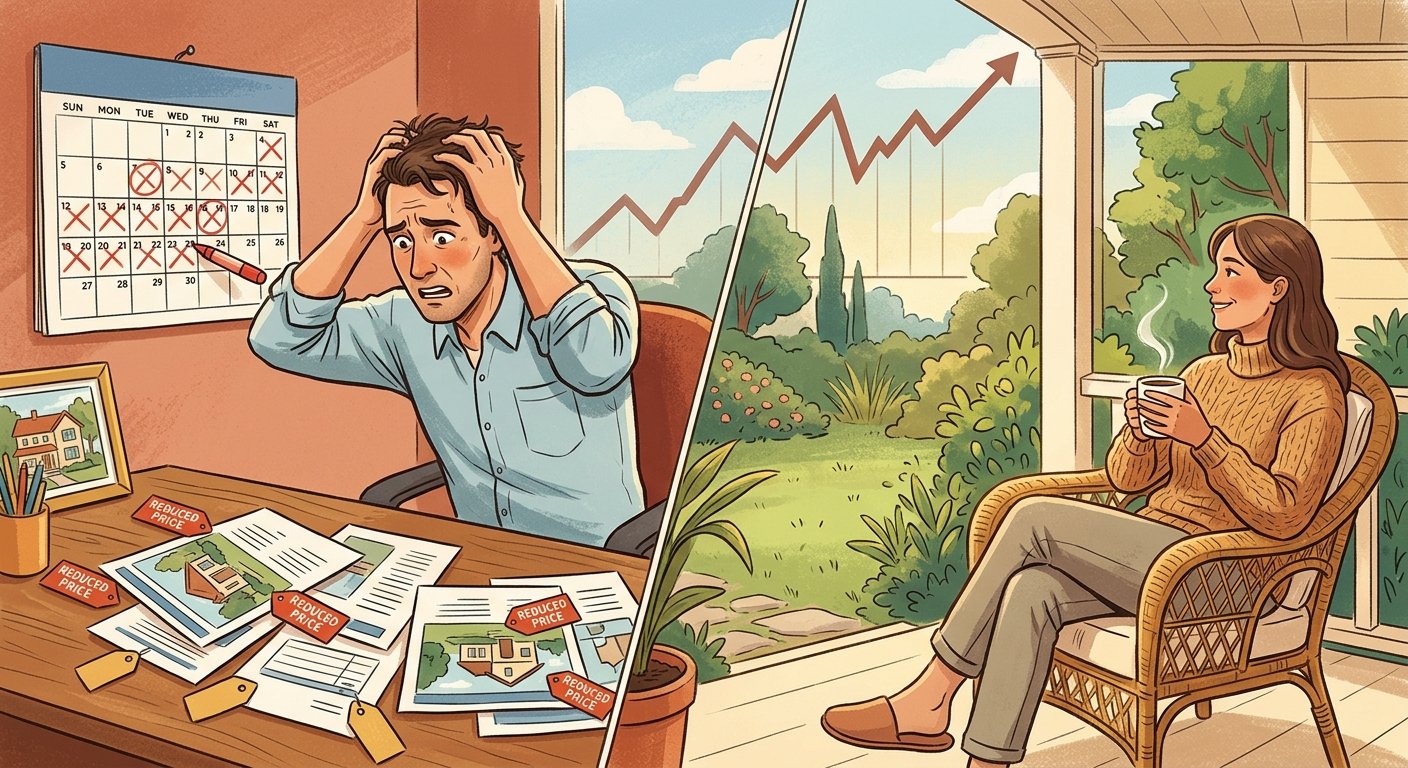
**Why it matters:** If you are buying, you have more room to negotiate on timing and terms. If you are selling, stale listings are now a real risk, so price discipline matters more than optimism.
The exposed groups are clear:
- Buyers who need financing, because the mortgage rate is the interest charged on a home loan, and rates have stayed above 6% since 2022.
- Sellers in fast-cooling markets, as supply in Austin grew by 145% from a year earlier.
- Owners who must move on a deadline, since houses are spending more time on the market.
- Housing-linked investors counting on quick resale demand, as mortgage applications to buy fell 19% from a year earlier.
The groups with cover are just as clear:
- Buyers with cash, as they are less exposed to borrowing costs while financed demand has dropped sharply.
- Sellers with truly scarce homes, as inventory is still expected to end the year below pre-2020 levels.
- Homeowners who do not need to transact now, as forecasts point to rates stabilizing in the low-6% range this year and declining through 2026.
Watch time-on-market first. That is where pressure shows up before the headline catches up.
The next dates to watch will decide how far it goes
September 2026 is where the next turn gets tested. Mortgage rates have stayed above 6% since the Federal Reserve, the US central bank that sets monetary policy, began raising interest rates in 2022, and that policy path still matters for housing.
- August 2026: Pending home sales fell 4.7% from a year earlier, a direct read on contracts that have not yet closed.
- August 2026: The median existing home sales price still rose 1.6% from a year earlier, extending the streak of annual gains even as activity weakened.
- September 2026: Mortgage applications to buy homes fell 19% from a year earlier, according to CNN, which is the cleanest near-term signal that buyer demand is still shrinking before sales data catch up.
The next scheduled pressure point is every fresh read on applications and pending sales. If applications keep falling and pending sales stay negative, transaction volume will weaken further, sellers will lose pricing power, and the slowdown will deepen.
Supply is the other timer. The market already has 4.9 months of supply, the highest level in more than a decade.
Stabilization needs a different sequence. Rates have to ease into the low-6% range and hold there through the year, which industry forecasts now expect, while applications stop sliding and pending sales flatten. A deeper slowdown is confirmed if rates fail to come down as expected through 2026 and demand keeps deteriorating despite more homes on the market.
Yes, the market is slowing, not collapsing
4.9 months of supply and a 58% seller-over-buyer gap settle it. This is a real housing slowdown, driven by expensive financing and weaker demand, not a collapse, because prices are still up 1.6% even as contracts and applications fall.
Watch transaction data first.
Key takeaways
- Rates rose first, then mortgage applications, home tours, and pending sales weakened, which is why the slowdown is structural rather than sentiment-only.
- Sellers now outnumber buyers nationwide, so bargaining power has shifted before headline prices have fully reset.
- If you are selling, watch contract activity and time on market before old comparable sales. Stale listings are the risk.
- If you are buying, more supply and weaker financed demand give you room to negotiate on price, timing, and terms.
- The next hard check is whether applications and pending sales keep falling. If they do, volume weakens further and sellers lose more pricing power.
Sources
- 1. [5 Signs the Real Estate Market is Slowing Down (And How to Navigate It)]( https://www.homelight.com/blog/is-the-real-estate-market-slowing-down/)